HOW DO YOU SEE INFORMATION AS A STORY?
Visualizing and organizing the perception of information

Cinematic interface design as a reference to example
Image above: © Cruise/Wagner + Amblin Entertainment
It might be said that the rise of infographics — visualizing, simplifying and organizing content into varying graphical arrays, pictograms, charts, diagrams and number counts suggests — the convergence of time [and the absence of it], the dithering disappearance of overflowing content [the sheer rise of information].

We have a client, a leader in visualizing data, Tableau.
There are a series of notations, we’ve written about them.
They live and work at the forefront of visualizing data —
fast analytics and rapid-fire business intelligence.

Meeting with the CEO, Christian Chabot, and his marketing team, we talked about the state of the art of newly expressing data. Tableau, at the core, is focusing on building the tools for its community to substantiate its storytelling of data — there are a string of links to examine. People grasp stories. And data, in that context, can be part of the story.
Girvin’s work in the motion picture arena — as designers, led to some discussions about the idea of how information is visualized, in charting and graphing analyses — lead programmers on the team said “that’s different, it’s not real, it’s fictional.”
We comprehend that principle, “it’s storytelling” unto itself, but in a manner, data is dataflow; it’s fluency — it’s some”thing” to “give” an object of in-forming and sharing; so to our thinking, it’s “some” thing” to be considered as a matter of aligning the future visioning of how people “get things” — the core of data is that re-gifting of the story of content, how [and now] people can understand more [faster].
Stories are, more often than not, held by readers
more than factual display of “what’s real, right now.”
Still, the world of infographical presence is large — there is a giant community of talent, and “visual objects” for infographical storytelling.
One might suggest, as well, that Tom Cruise and Steven Spielberg’s interpretations [ back in 2002] of visual data manipulation isn’t — at present — far from the truth.
Interestingly, much of the interface attributes of perceiving the layering of information are specific to Apple UI clues, real time examination of content, layered — and “sliding them.” However, not in the context of a floating screen projection, as noted above.
In studying Ridley Scott’s efforts on Prometheus, screen analyses of data relates to hard screen displays. It was in the discussion of these items – world mapping and cosmographical representation — walk-through worlds, that I’d commented to the Tableau team — in some time, the display of data will be live, the literal interpretation of worlds, and the stories tied into them.
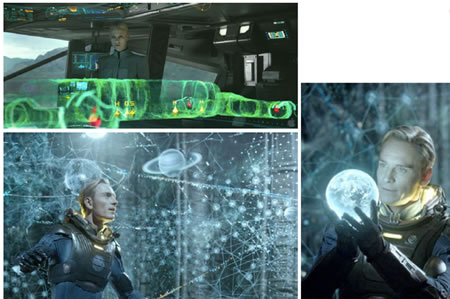
Other futurist treatments of UI design — many times, intimately detailed, as in the work of Jayse Hansen — for the Avengers [as well as Tony Stark, the Ironman, himself.]
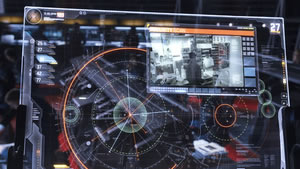
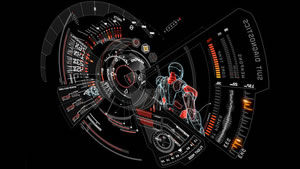
Or, Mr. Stark’s helmet interface, live definition of “environmental + experiential data” that inherently relates to his storytelling — and the realms of adventure in which he lives:
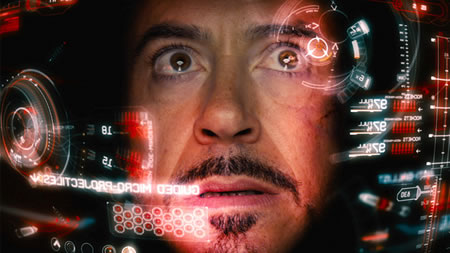
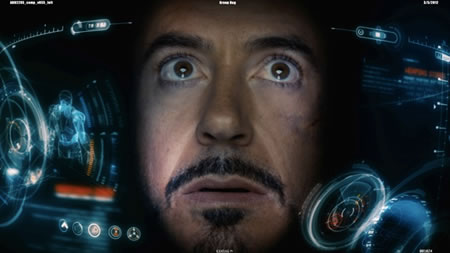
Here, stories are told — the data represents experience, in context,
it is telling a story for / from the experiencer.
The Prometheus story relates to analysis of environment, which, too — is intimately tracking and tracing the threading of the story, since in a way — route, insights and conditions — are tractable intimations of “what happens” to the experiencers.
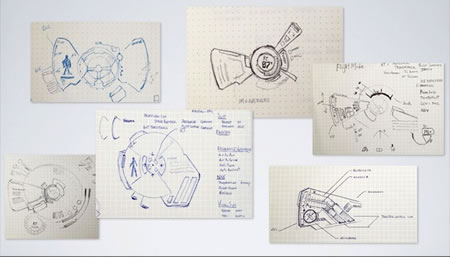
Jayce Hansen designed the screen storytelling of the UI / “infographics” for “The Avengers” — including the Iron Man UI. These are screen based, albeit transparent screen suggestions.
That, too, exists.
A reference to his working drawings, from Gizmodo:
S.H.I.E.L.D Helicarrier interface:
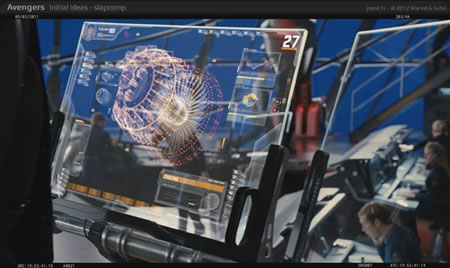
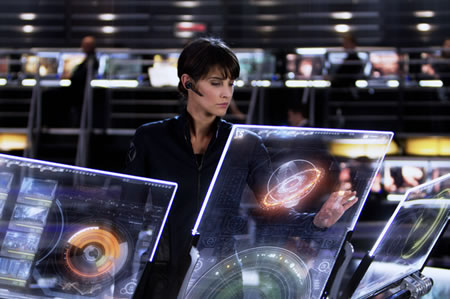
Screen commander:
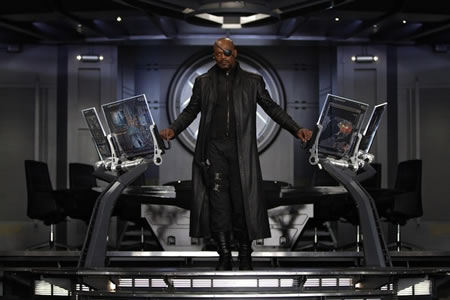
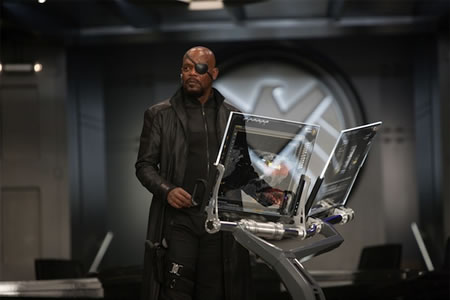
Point is, for me, that it might be that the theatrical UI [fictional] experiments with the idea of examining and organizing data might be a path to consider how we see, manipulate content — quickly understanding more.
And more. Faster.
Still, the draw[ing]
will be the story. For inherently, the very nature of storytelling is about the grasp of content, context and emotionality – and finally, to “relating” and relationships [brand, for example] what people actually carry away in that “relating.”
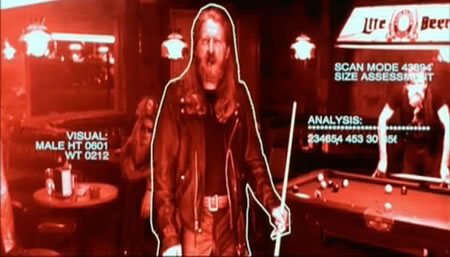
Terminator 2 | sizing up clothing.
Image courtesy of Lightstorm, Canal+, Columbia Tristar
Tim | GIRVIN ISLAND STUDIOS
…..
G I R V I N | DESIGNING MOVIES
THEATRICAL BRANDING + ENTERTAINMENT
IMAGINATION: AND THE TOOLS TO MAKE IT HAPPEN
http://bit.ly/seAMZf