Rethinking how ideas are shared
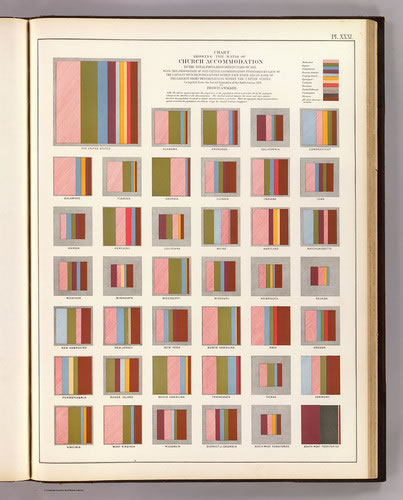
The explanation of ideals, mapped in a navigation of content.
“Where am I going, how will I get there — being lost, I don’t “get where I am” — “having a map, with information, I have a map, a visualization of way, found.”
It might be that the map — the cartographic treatment — is a core symbol of the idea of how people see the layering of complex information as a journey.
And as a story — as they make that journey.
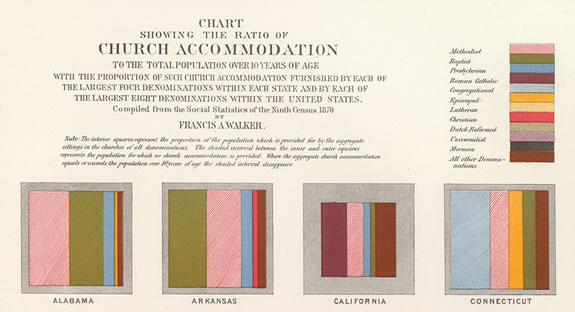
Storytelling
information.
The idea that something can be simpler, newly perceived in the context of rethinking the landscape of content, placing that in-formation in a way that new stories can be held, shared and told to others in a new manner, accelerating the grasp of content — so that they can share in the tapestry view — many threads, layering in the content of knowledge scene — and finally, freshly woven in another tiering of expression —
the warp, the weft, the detailing of comprehension in a new view.
Seeing and holistically sensing metaphors, in the sharing of symbolic views of how ideas and be recanted and rediscovered —
scene seen anew.
Interesting that this idea is not new, but hundreds of years old —
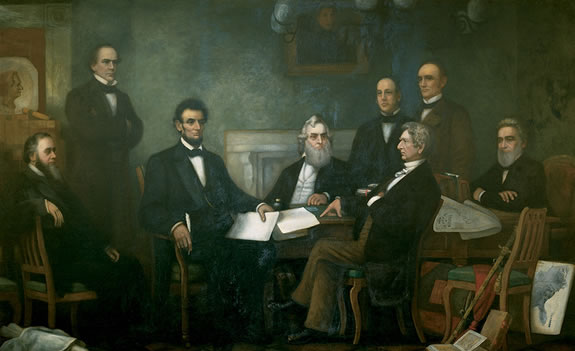
The census an informational mapping — which is a kind of human storytelling, published just before the advancement of Civil War. It appears in the lower right-hand corner of the famous portrait of Lincoln announcing his policy of emancipation to his cabinet.
— rethinking the presentation of information, that in turn lends itself to new understanding.
New stories to be told.
And searching, that finding:
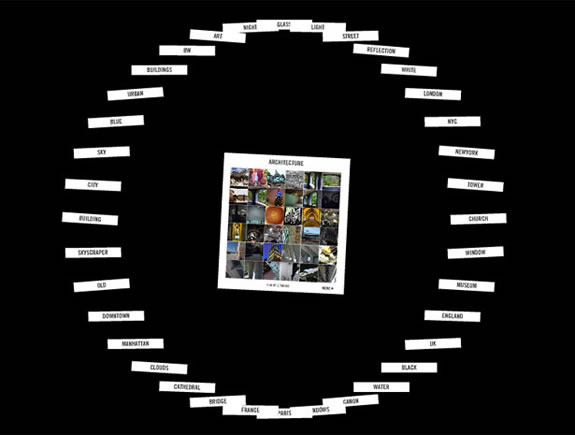
New ways of seeing.
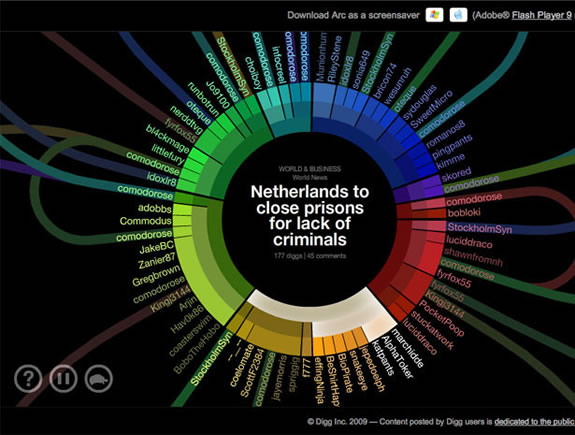
More — other gathering of the mapping, the cartography of ideas:
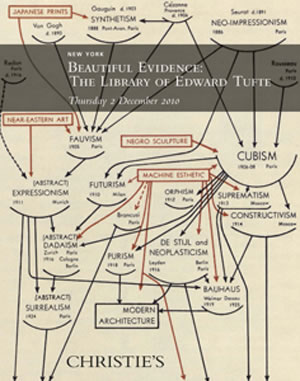
Edward Tufte [we’ve written about him]
offers these collections, as well.
Fast Company offers this collection, below:
| 11 Of The Most Influential Infographics Of The 19th-Century | |
| We live in a world steeped in graphic information. From Google Maps and GIS to the proliferation of infographics and animated maps, visual data surrounds us. |  |
Girvin’s notes
on visualizing the storytelling of information.
Tim Girvin | GIRVIN QueenAnne
Work-Life Studios
….
WEAVING BRANDSTORIES
CROWD MIND | EXPERIENCE DESIGN | MEMORY STRATEGY
http://bit.ly/Q1Pm6e